Get the most out of your data
To optimise production and application processes, large amounts of data and status information are collected and processed in endto-end analytics solutions. The collection and analysis of digital data offers advantages especially in case of increasing networking and remote monitoring of decentralised structures, such as infrastructure facilities, buildings, machines, and installations. Many structures can be monitored simultaneously at many individual measuring points.
Condition monitoring is a major part of predictive maintenance as implementing condition monitoring allows for maintenance to be scheduled and reventive actions taken to prevent damage, future failure and subsequent unplanned downtime of the machinery as well as a consitent product quality. But in order to be able to use all these costs and competitive advantages, a software solution is needed that can only collect and evaluate the really necessary data and draw the appropriate conclusions about possible upcoming damages.
The Althen IoT monitor is the perfect solution for your monitoring challenge!
Your advantages
- Easy-to-use
- Tailored to your specific needs
- Usable with various sensors
- Safe data storage in the could
- A great choice of widgets for different visualizations
- Clear (and fast) overviews for subjects and events
- Powerful filter and aggregation options
- Low-cost
-
Ready-to-useIncludes all recessary settings and tests.
-
Flexible systemNumber of users, hierarchy levels etc.
-
Free trainingOne hour training included.
What are the possibilities for monitoring?
The IoT Monitor offers you different levels of monitoring, from simple threshold trigger on scalar values to up to the interactive FFT analysis and diagnostics. We provide the settings for the connected sensors for you. When we hand over the system to you, it has already been fully tested and all the necessary settings have been made. In addition, you will receive a briefing on the dashboard from or experts. Getting started has never been easier!
Basic
- Threshold trigger on scalar values
- a-RMS/p2p/z2p*
- v-RMS/p2p/z2p*
- Crest factor
- Kurtosis
- Temperature
- according to ISO 10816
- Machine groups 1-4
- Rigid /elastic threshold zone D
- Or user defined
- Alarm history, alarm email
*peak-to-peak/zero-to-peak

Pro
- FFT display
- Filters
- Filter alarm
- FFT history-based alarm
- plus all basic options
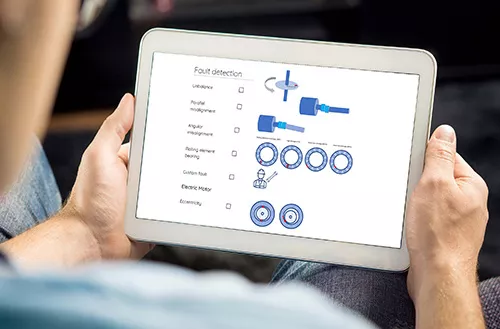
Intelligent
- Diagnostic functions
- Unbalance
- Parallel misalignment
- Angular misalignment
- Rolling bearing/ball bearing
- Eccentricity of stator and rotor
- User defined error detection
- plus all basic and pro options
To meet your measurement needs
-
Intelligent fault detection6 x options
Detect unbalance, parallel misalignment, angular misalignment, rolling element bearing etc.
-
Hierarchy levels10 x levels
Plant overview with images of your locations/factoies/production lines/floors/machines.
-
Number of users10 x users
Access for up to ten users in the basic version of IoT monitor.
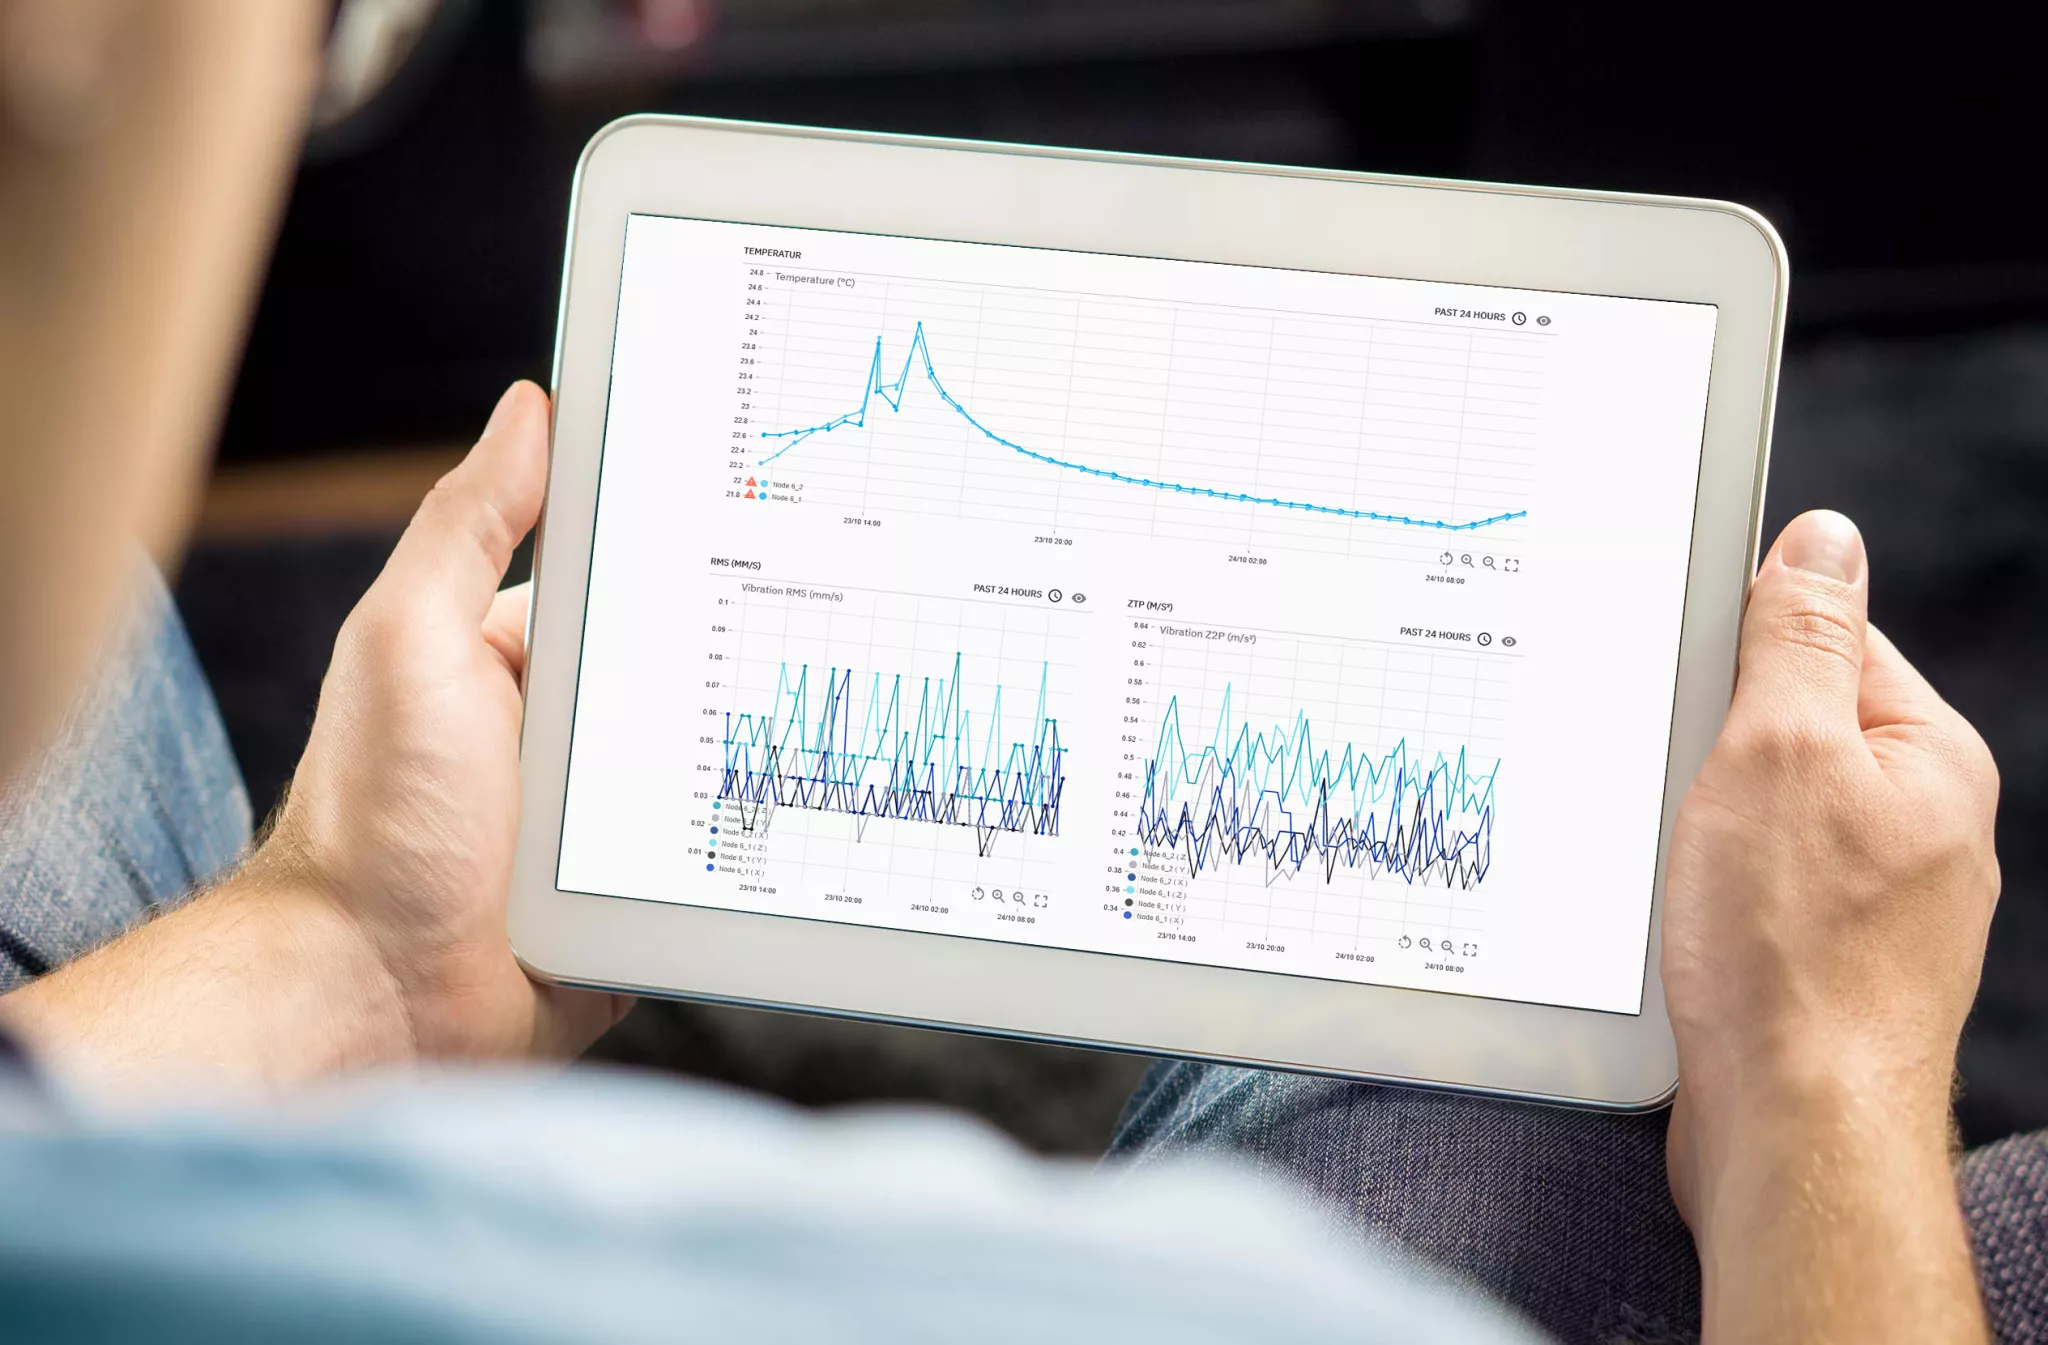
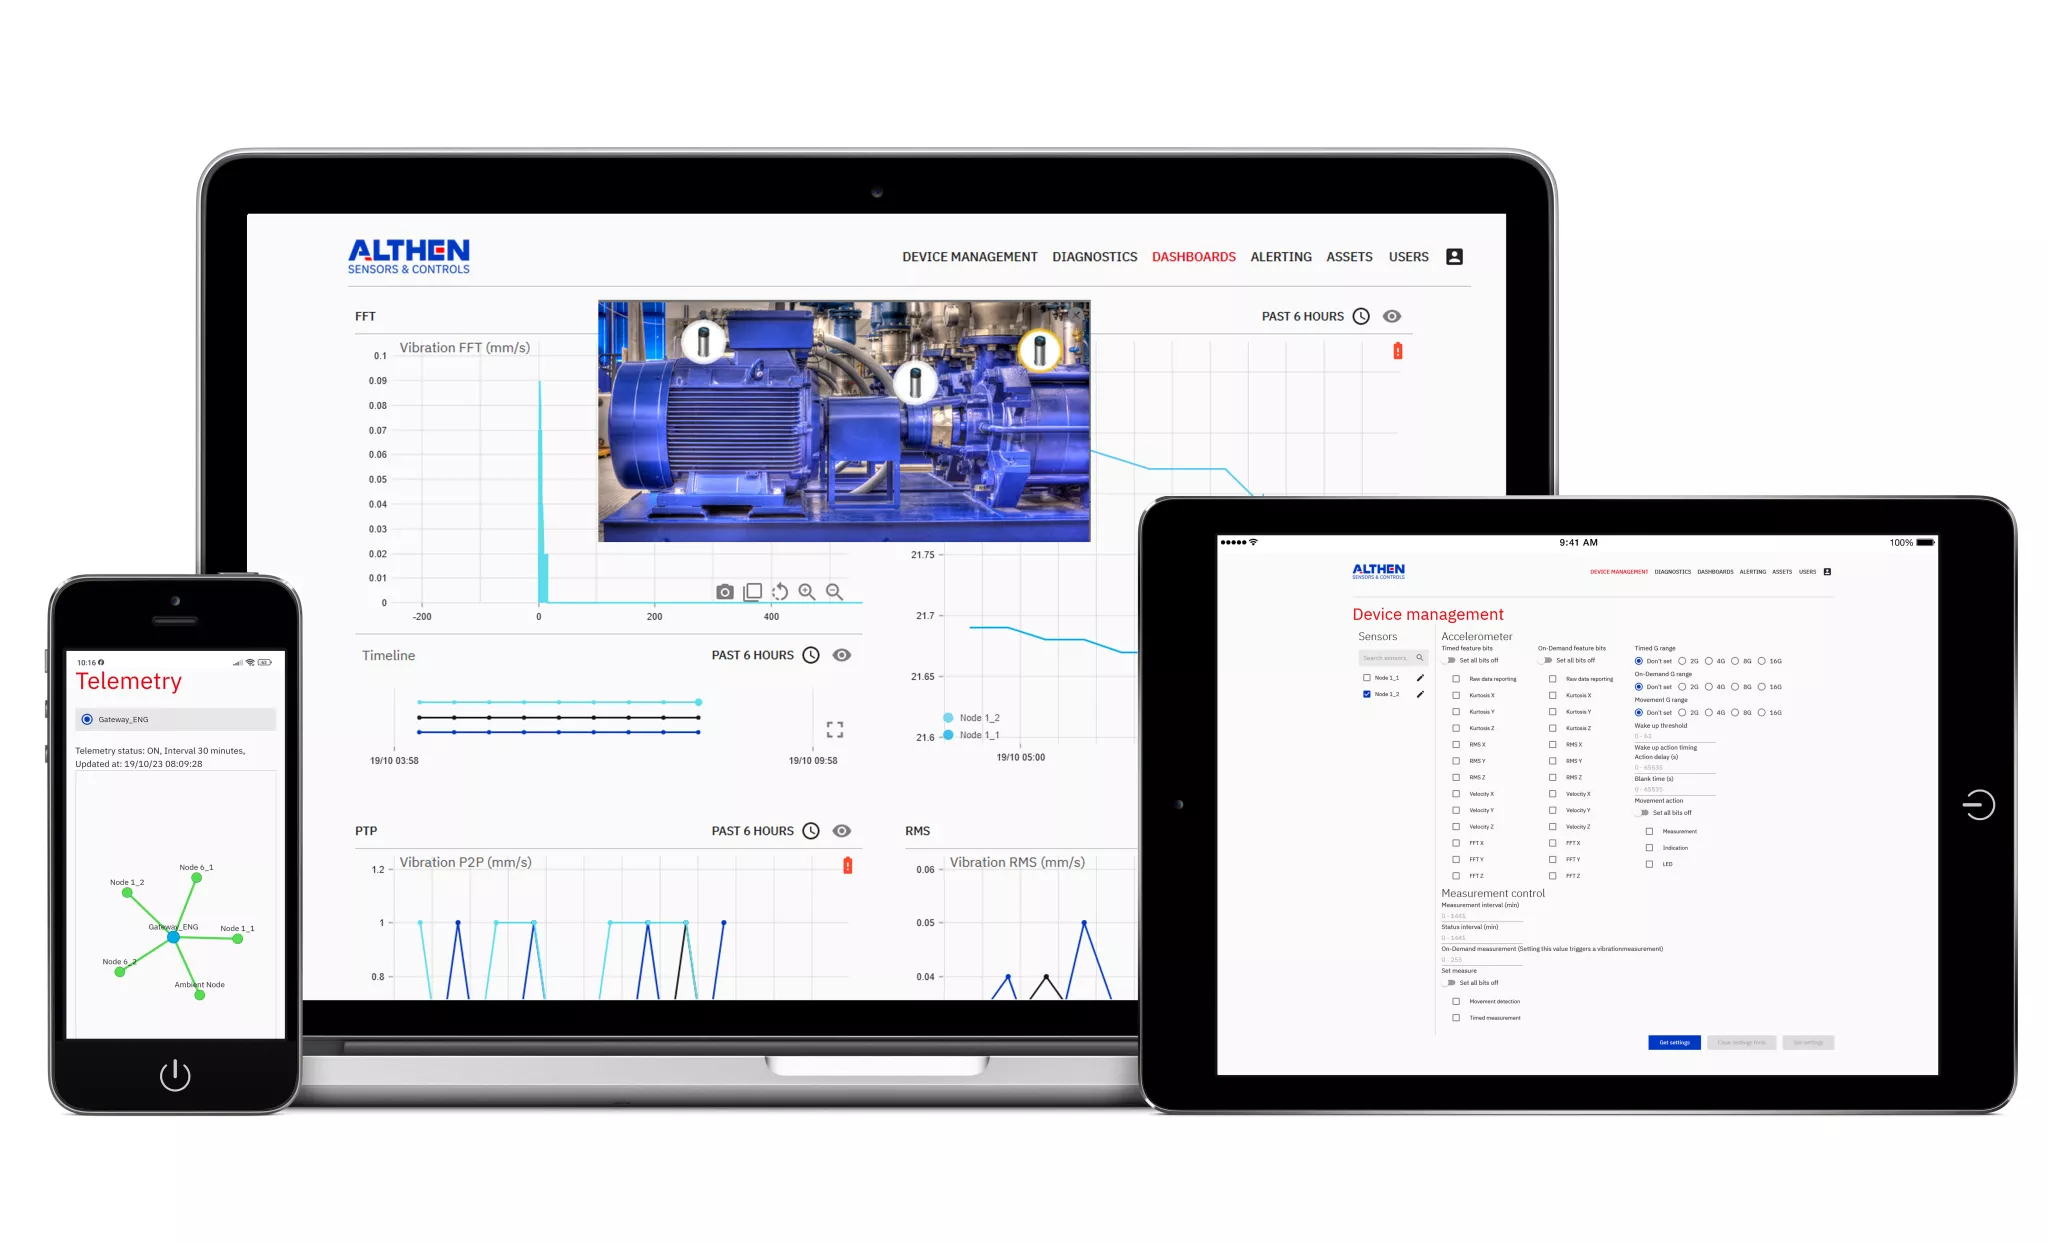
Dashboards
The IoT monitor allows you to create and manage you own dashboards. The interactive charts allow you to e.g.
- view single frequencies,
- adapt the scaling,
- set filters,
- change the time frame
- add comments to selected measuring points,
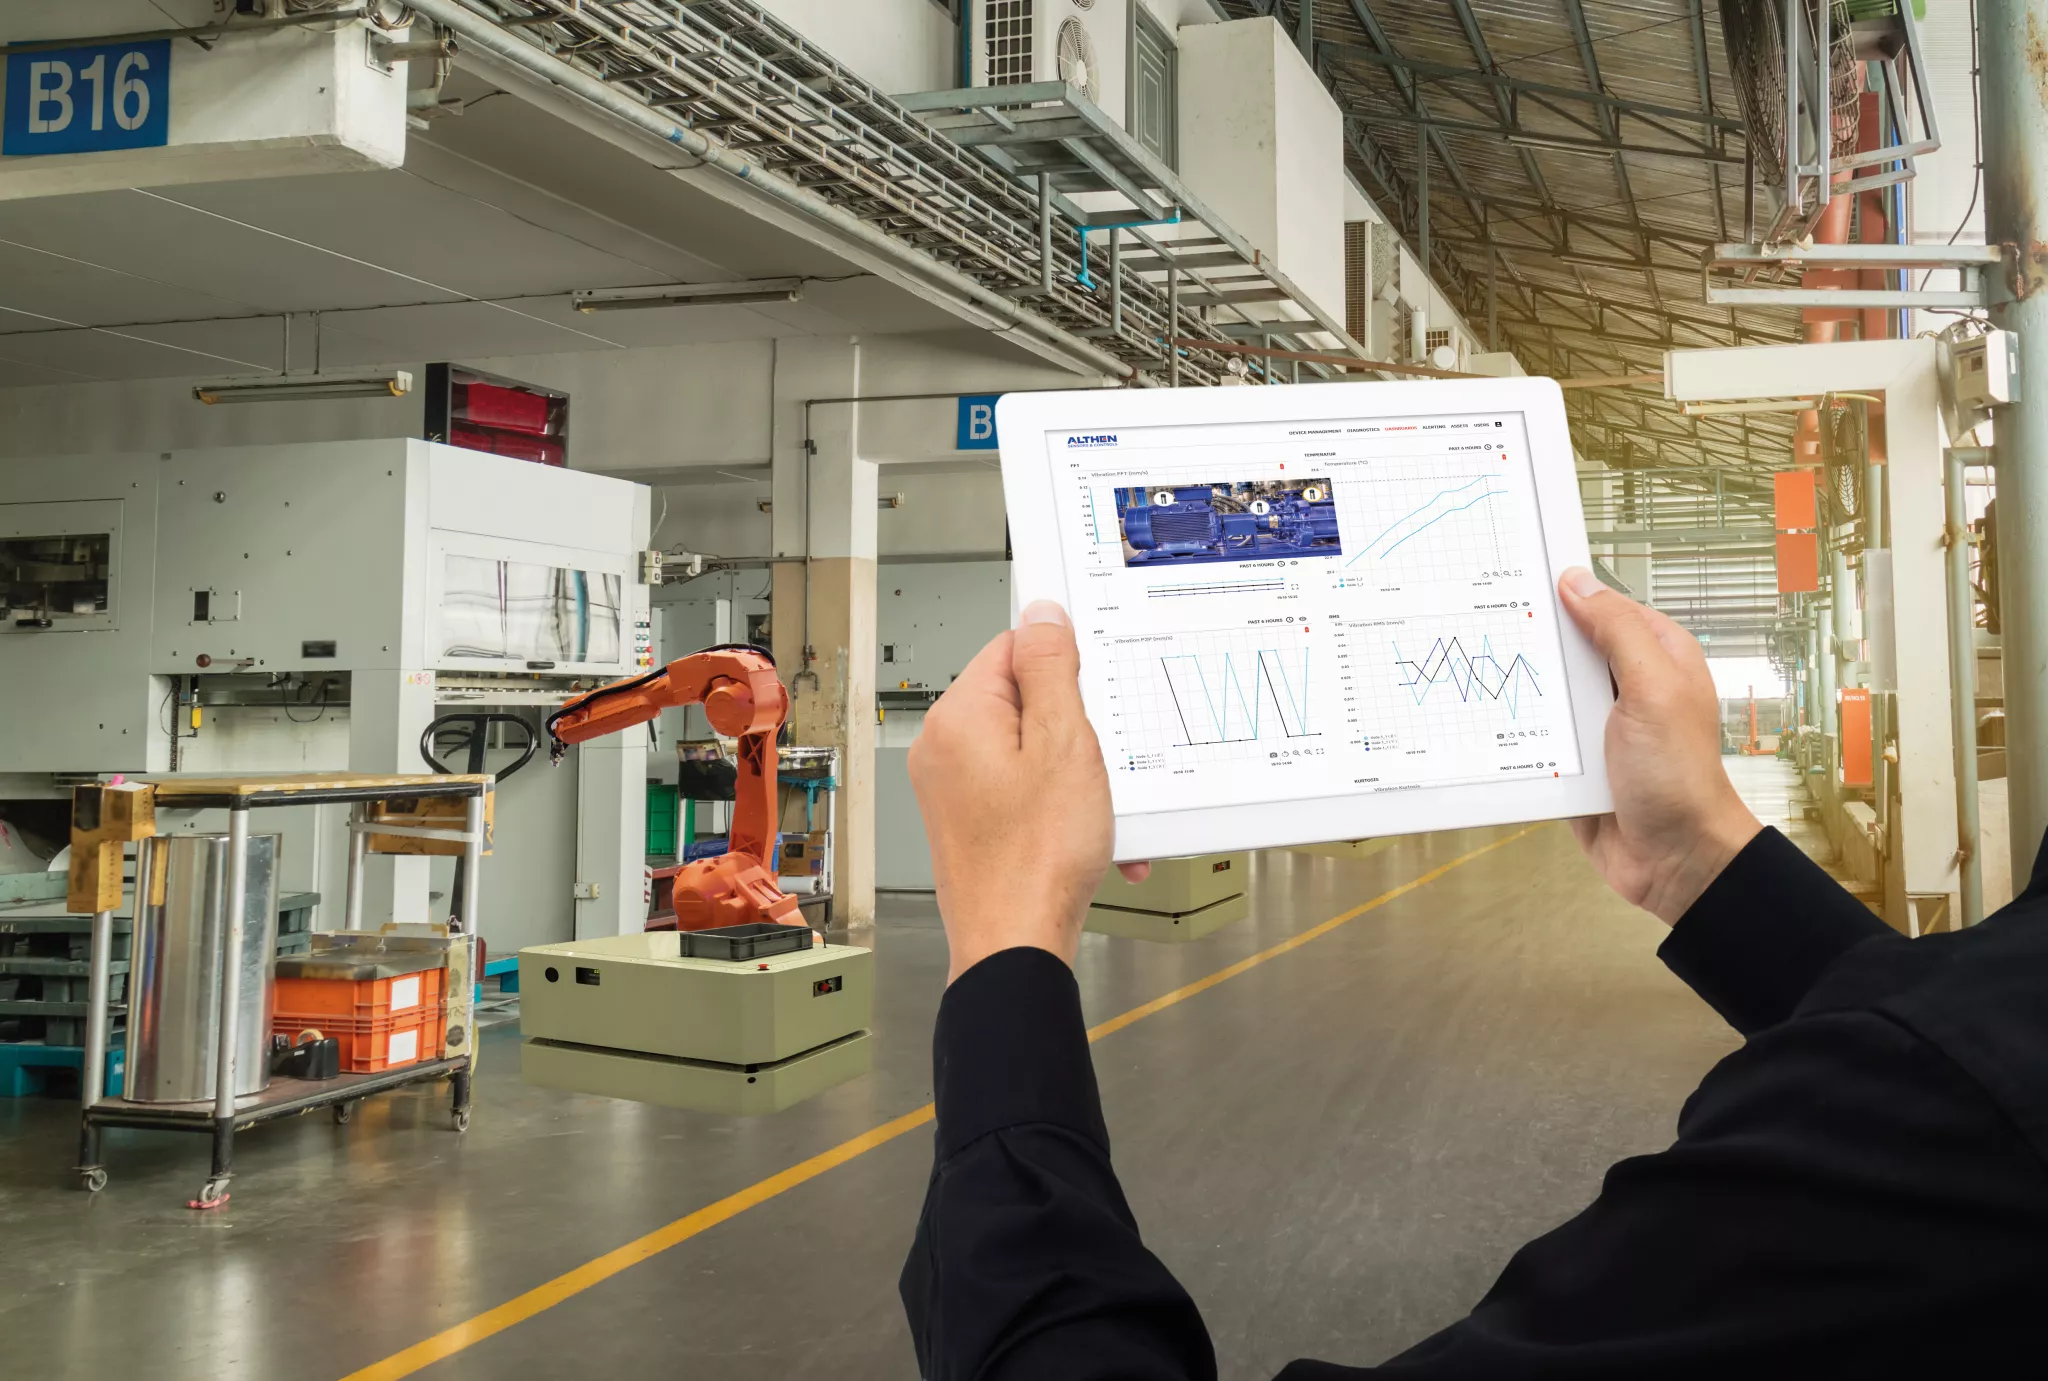
- view the machine with the mounted sensors (image)
- checkt the battery status
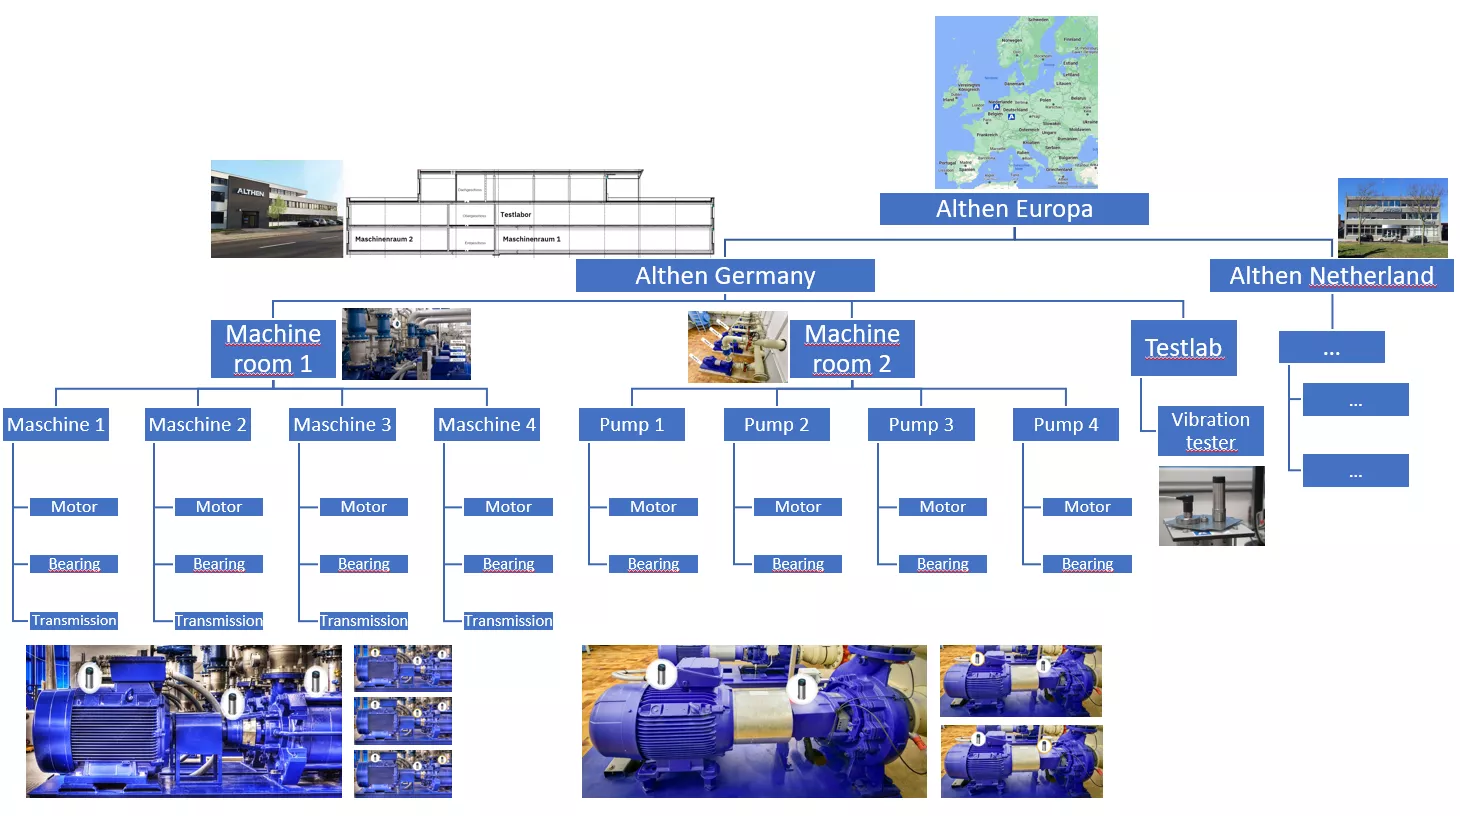
Real facility overview
No more abstract data: In the IoT Monitor we can implement images of your production lines, floors, plants and machines. You can immediately see which sensors on which machine in which floors deliver the corresponding data and where the sensors are placed. The system is organised hierarchically and clearly structured. Keep the perfect overview!
Whitepaper IIoT
Setting up and commissioning an IIoT solution: from selecting the platform with wireless acceleration sensors to monitoring and commissioning.
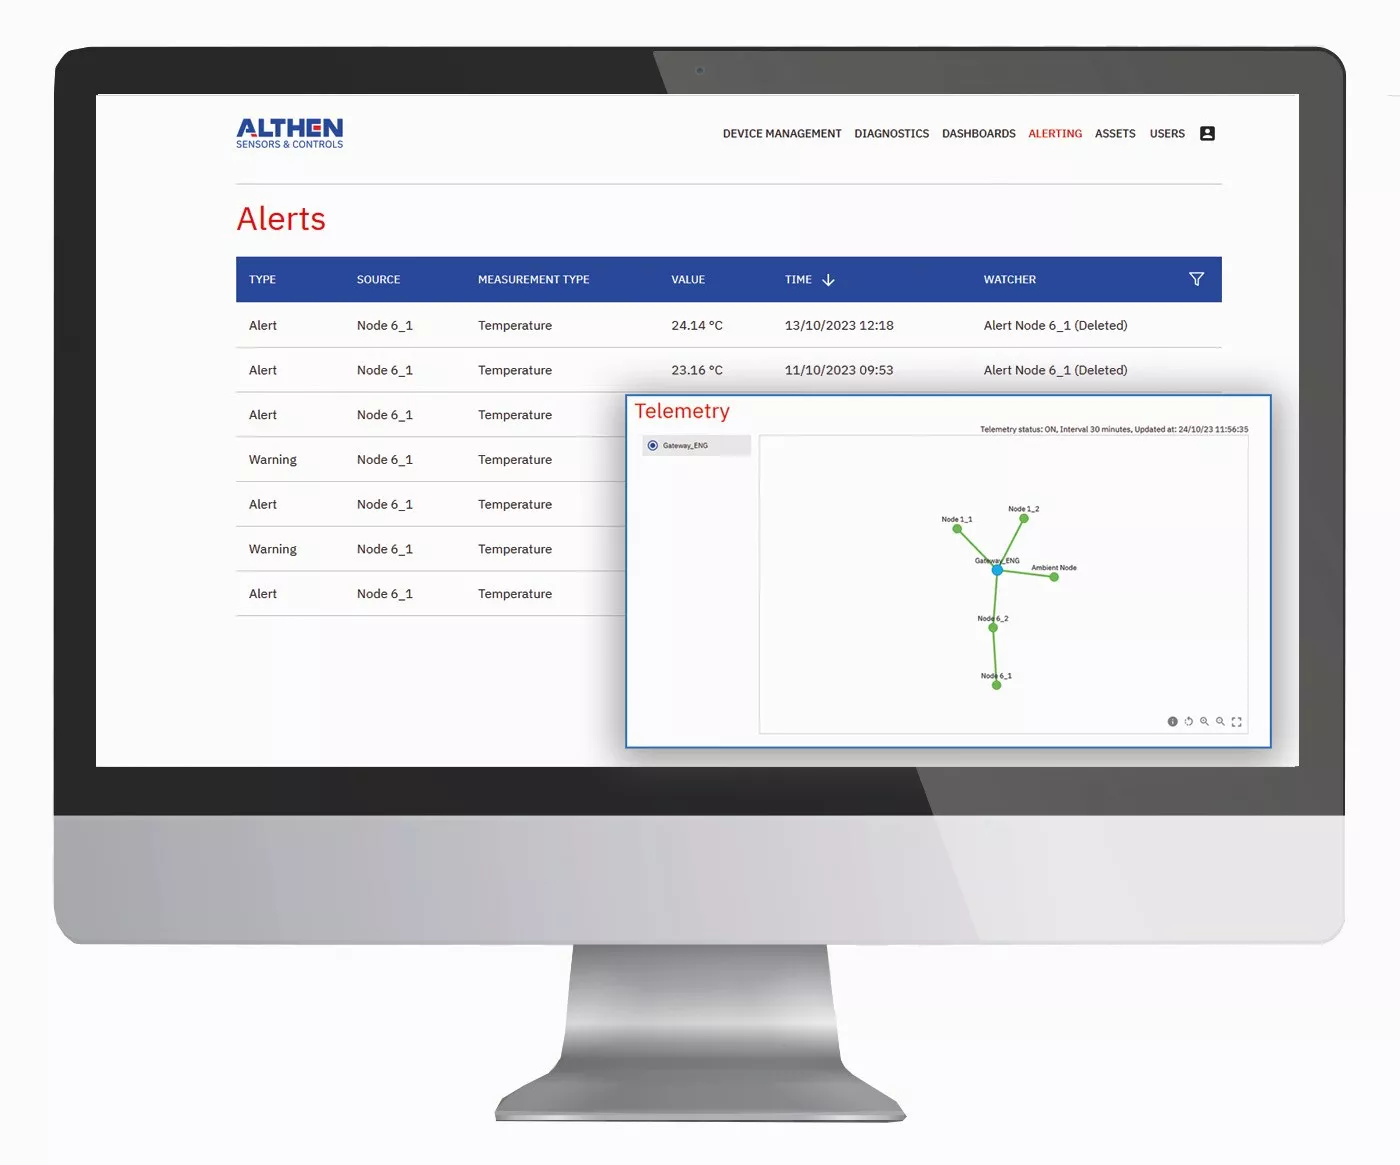
Alerts
You would like to be alerted automatically as soon as certain predefined measured values are exceeded? With the alarm function you are able to set your own alerts, based on individually determined thresholds. The alert can also be sent by email to your email inbox. The alert history provides an overview of all past alerts.
Telemetry
The Telemetry chart shows you the networking of the sensors and the gateway as well as the order in which they communicate. The colour of the dots and lines provides information about the current status or the accessibility of the sensors.
How can we help you?
Do you need advice or help with your IIoT measurement project?
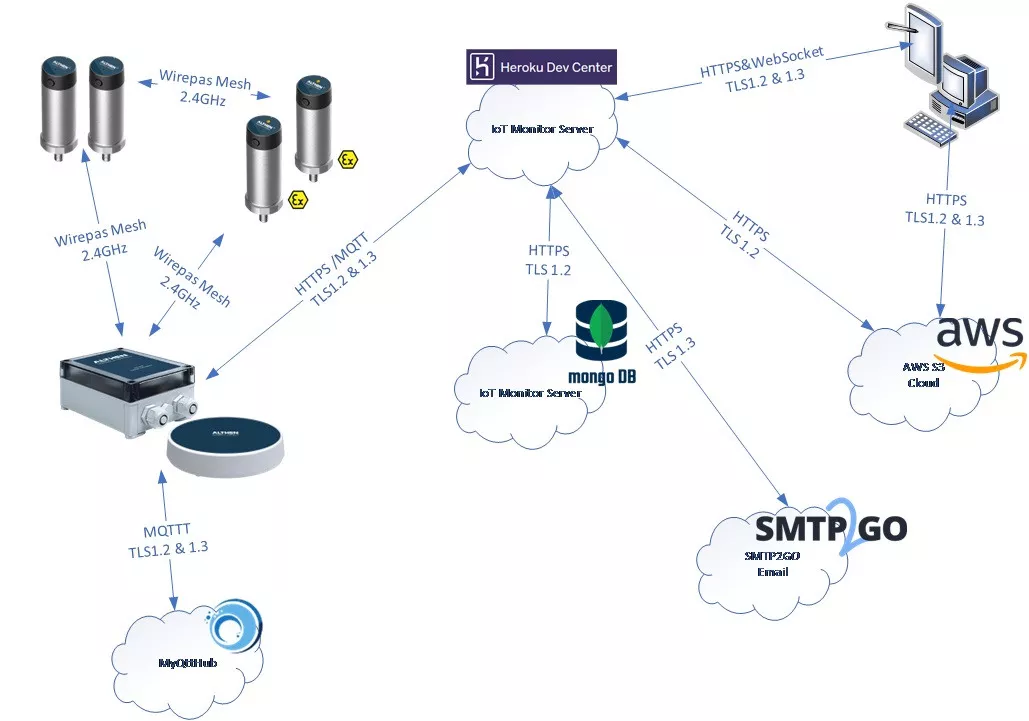
Seamless integration into process control systems
The process control system (PCS) acts as the central control and monitoring unit in the company. It is from here that the monitoring and control of various processes and systems in the entire company or in a specific plant takes place. To ensure a clearly organised control room, it is therefore advantageous if a separate monitoring solution is not required for each system or monitoring. Althen's condition monitoring system offers a flexible solution here, as it can be seamlessly integrated into various external or third-party systems.
Althen utilises the extensive possibilities of MQTT/MQTTs and HTTPS protocols, which offer a smooth connection to process control systems from various manufacturers such as Siemens, Yokogawa, Emerson and ABB.